See surface texture differently

5 Mins
Published in Surface Measurement
Sensofar UK speaks exclusively to Measurement & Manufacturing about why optical areal surface characterisation can yield far more information than traditional roughness measurements
By definition, when it comes to measuring surface roughness, there’s nothing wrong with Ra (the arithmetic mean height of the roughness profile over the evaluation length). The problem comes when a single number is expected to tell the whole story about a surface.
Harry Willcox, Technical Sales Manager at Sensofar UK, outlines the issue. “If you’ve got a surface where texture varies, you could measure Ra in one position and get a completely different result from a second profile measurement located just microns away.”
To illustrate further, consider a hypothetical 3D-printed component. Taking a single measurement might produce an Ra of 5 µm. If the tolerance limit is 6 µm, the component passes. Taking another measurement a few millimetres away might yield the same acceptable result. However, somewhere between, Ra might read 7 µm, indicating a failure. The worst thing? Nobody in the QC department would know.
By evaluating an area rather than relying on a profile, manufacturers can identify potential surface variation that might otherwise go undetected, assuming the appropriate selection of measurement area and analysis parameters.
“That’s the whole argument in a nutshell,” states Harry. “Optical areal measurement gives you way more surface data than individual profile measurements, so you can make a more quantifiable decision about whether a component is acceptable.”
More than roughness
From a terminology perspective, surface texture encompasses the surface irregularities remaining after form is removed, including roughness and waviness. Areal characterisation can additionally describe spatial features such as texture direction. ISO 25178 provides an internationally recognised framework for evaluating these characteristics using areal surface measurements.
Regardless of the phrasing, an informative Sensofar handbook entitled ‘The Areal Surface Texture Handbook: Understanding ISO 25178’, sets out why this international standard for the analysis of 3D areal surface texture and roughness provides the parameters and framework for correct evaluation.
“Deciding which parameter in the standard to use hinges on the intended function of the surface,” comments Jamie Greatrix, General Manager and Commercial Director at Sensofar UK. “We shouldn’t just assume we want to measure Sa, for example, we need to understand why Sa is the optimal parameter.”
Sa is the areal arithmetic mean height parameter, analogous to Ra when comparable roughness filtering is applied. But it isn’t necessarily the best parameter for every application of this type. ISO 25178 spans a broad range of areal parameters, including height, spatial, hybrid and functional characteristics.
“Sometimes there’s not just one answer,” remarks Jamie. “It depends on what you’re trying to achieve and what the surface is doing, as well as the optical technique deployed.”
The penny drops
This biggest challenge is not in the technology, but in the understanding.
“We get pushback from those who’ve been using tactile profilometry for many years to extract an Ra value and get parts out the door,” reveals Jamie. “Dissimilar results can occur because tactile and optical instruments interact with – and spatially filter – the surface differently. This doesn’t necessarily mean that either measurement is incorrect. Tactile measurements can be limited by the stylus tip radius, whereas optical systems can capture fine surface details without physical contact. 3D areal measurements provide a more comprehensive understanding of surface texture than a single 2D profile, particularly for complex or non-uniform surfaces.”
Adds Harry: “We should of course add that optical areal methodology isn’t always better. There’s still plenty of applications where tactile remains preferable. For example, if you’re machining prismatic parts with a relatively straightforward roughness requirement, a handheld roughness tester will prove perfectly adequate.”
The argument for optical areal measurement manifests when manufacturers need to understand more about what’s happening across the entire surface.
The bigger picture
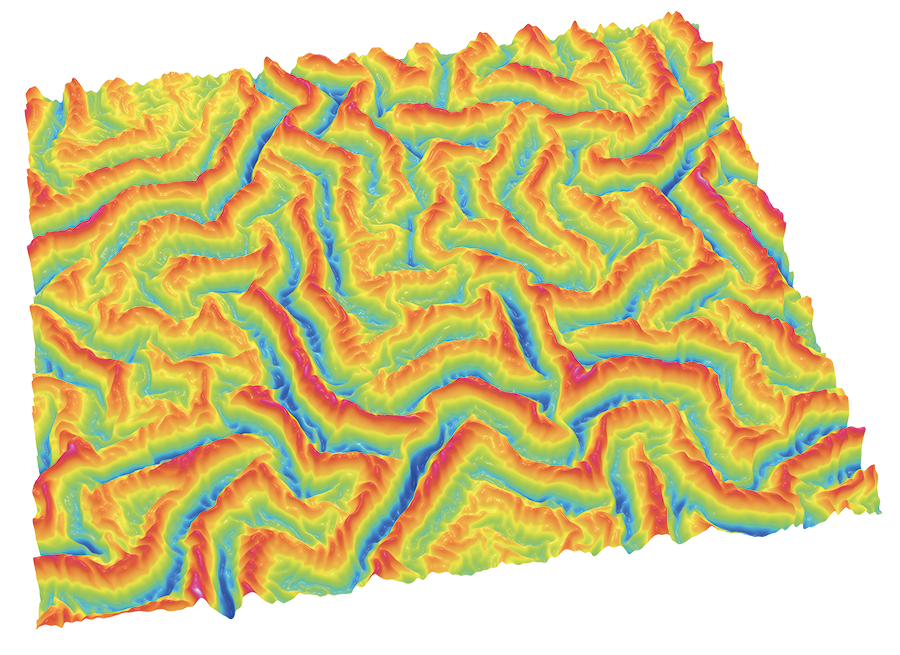
The real USP of optical areal surface characterisation for precision engineering businesses is data, largely because it helps users look at consistency in manufacturing processes. 3D surface datasets can reveal directionality, peaks, pits and other characteristics that profile measurements often miss or cannot capture.
“There’s sometimes a misconception that measuring a larger area means compromising on measurement quality, but that isn’t necessarily the case,” remarks Jamie. “Modern optical profilers can deliver highly repeatable, metrology-grade measurements across an area, allowing us to understand not just individual surface features but how those features vary across the component.”
He continues: “It’s important to understand that adopting areal measurement doesn’t mean abandoning the profile parameters manufacturers rely on. We can extract all profile roughness parameters and filter them according to ISO 4287 (legacy, now withdrawn) and ISO 21920 (current) standards for profile roughness measurements, while simultaneously evaluating the overall 3D dataset. The result? Users gain the ability to maintain their previous workflows and begin taking advantage of more surface data.”
From lab to line
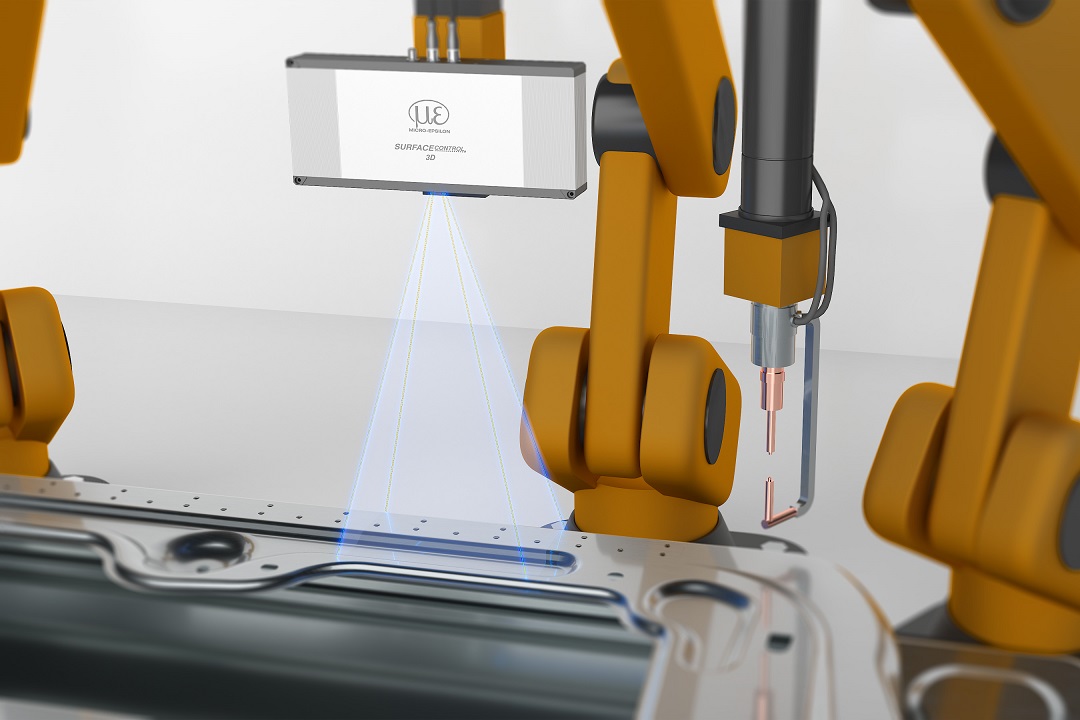
Another perception Sensofar is keen to challenge is that optical areal surface measurement belongs in a research lab. However, the company’s portfolio spans industrial and integrable applications – essentially sealed 3D sensor heads for in-line production and robot-mounted measurement on the shop floor.
It’s a pertinent point for manufacturers looking to relocate inspection closer to manufacturing rather than operating a conventional QC department. Sensofar systems can collect areal surface data in seconds in some applications, making it increasingly practical to use the technology in-line or near-line as part of the manufacturing process.
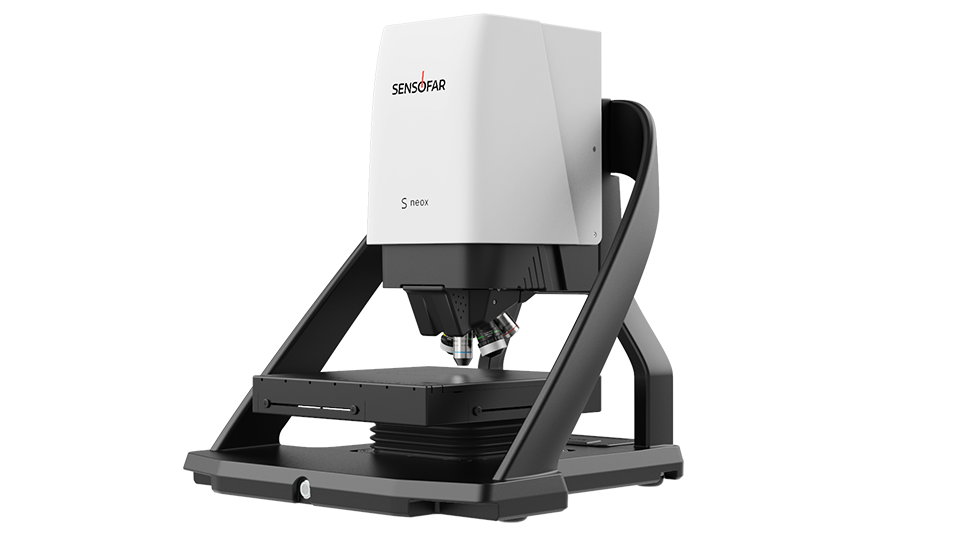
A major differentiator for Sensofar is its multi-technology approach, combining confocal microscopy, optical interferometry and focus variation for 3D surface measurement, alongside spectroscopic reflectometry for thin-film characterisation. The latest Sensofar S neox 6 brings these complementary technologies together within a single optical metrology platform.
Surfacing the benefits
For precision engineering companies still relying heavily on traditional profile measurements, Sensofar isn’t suggesting they throw away their existing equipment. Instead, Jamie believes the best place to start is with a real manufacturing challenge: “Send us an actual component and we’ll generate an information pack with a full optical areal breakdown of its surface free of charge. It will almost certainly include information you didn’t know was there and could prove beneficial.”
The transition from profile to areal measurement isn’t really about replacing one number with another. It is about asking whether the number currently being measured tells you enough about the surface to make confident decisions.
“The precision engineering sector is steadily moving towards high-end, metrology-grade optical areal surface roughness measurements,” concludes Jamie. “We’re seeing demand grow in segments like medical device/surgical implants, as well as defence and aerospace. We’re also currently working with manufacturers of cutting tools, fuel injector nozzles and automative cylinder liners, among others. Taking the first step just means looking at a little more of the surface. You’ll be surprised at what you might find and how it could benefit your operations.”
Want to know more about this article?
Ask us below...